

Metrics
Where to measure performance?
If we run from our machine and test from our machine, we are only testing our local dev environment. This can be done with tools like LightHouse. This is lab data.
We can test against users with traditional APM tools ie Pingdom. This is synthetic data.
Finally, we can test with synthetic data from people who actually use our sites on their devices from monitoring services ie RUM tools (like Request Metrics). This is field data.
Chrome user Experience Data
We want to cut through the signal and the noise.
- Lab data has low noise, low signal.
- Synth data is higher on the scale.
- Field data has the largest signal AND noise. There is a trade-off.
Performance in the field, Chrome has been pulling all this data back and publishing it month in the Chrome User Experience datasheet.
There is a website that has made this super easy for us.

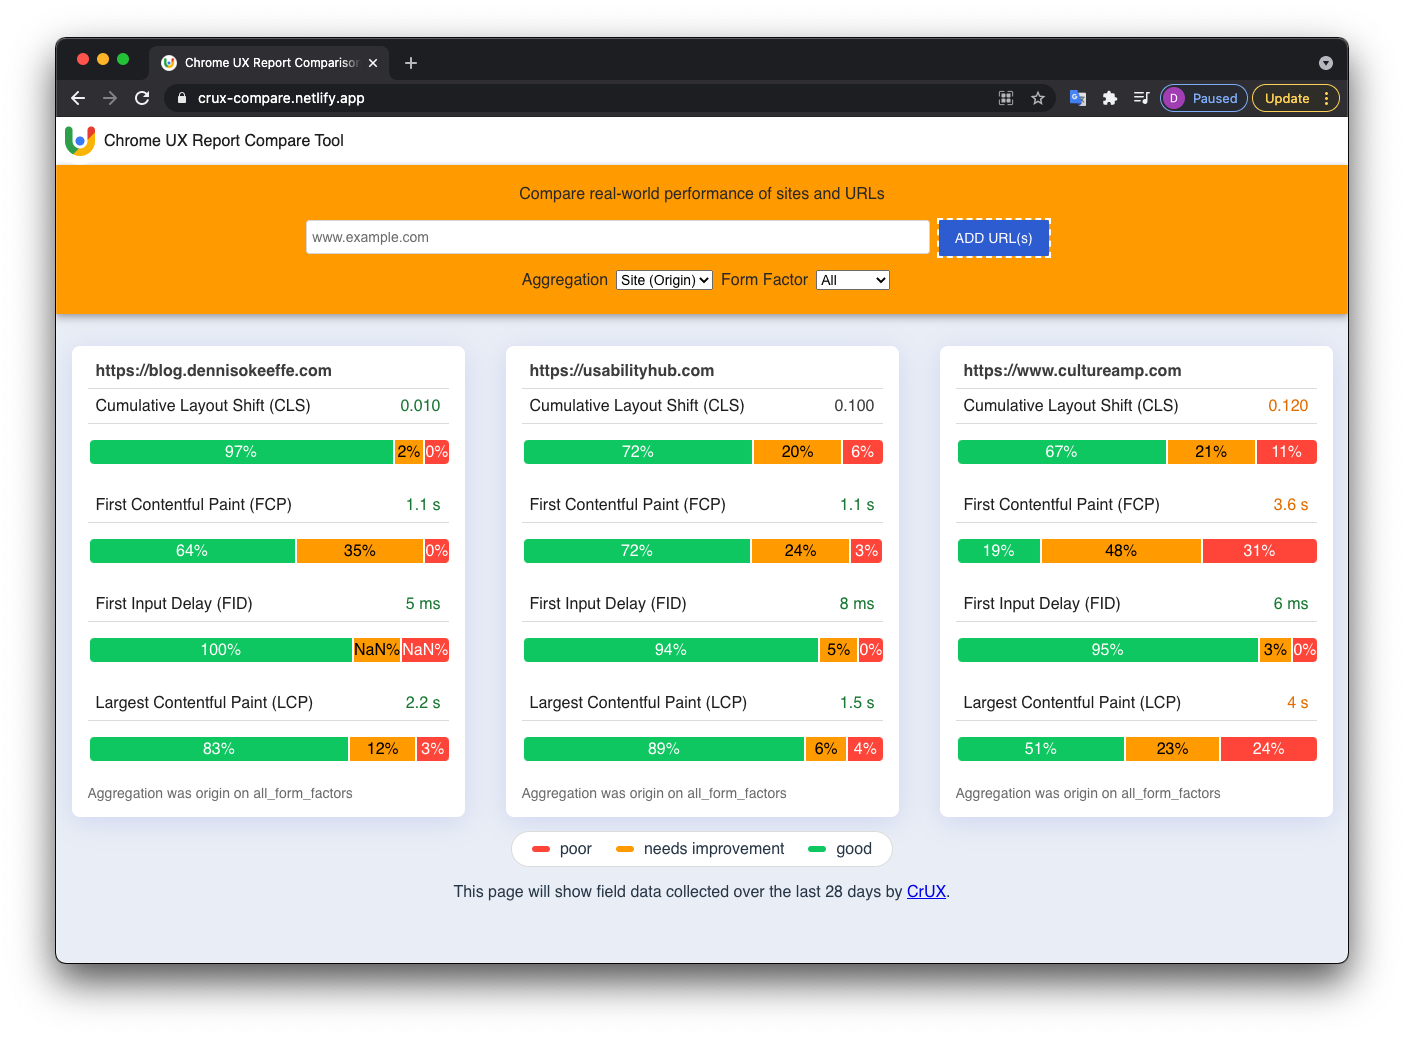
Web vitals example
There is web.dev that is a great resource to explain the latest and greatest performance metrics and their impact.
What you should not from the Crux compare website is the local "lab data" vs the "field data" that is grabbed from the report. Why does this happen? Field data comes from real users.
Intepreting Field Data
We have to figure out how to interpret the data that we collect across the different types.
When we look at the field data, we need to understand that we are taking a sample. The APIs that send this data for us are Blink browsers ie Chrome and Edge (Safari and Firefox do not send this).
Chrome on iOS does not send data as it is a thin wrapper around Safari.
Our data will ignore all the older browsers as well and there may be negative bias on phones (specifically given they come from Android which is a lot slower on web applications than iOS).
You have to think about all of these biases and bring them into your data.
Taking averages
This is not a great idea. The skew here can be very misleading.
Field data is normally interpretted in percentiles (ie p50, p75, p95).
Google generally compares against the p75 for your ranking score.